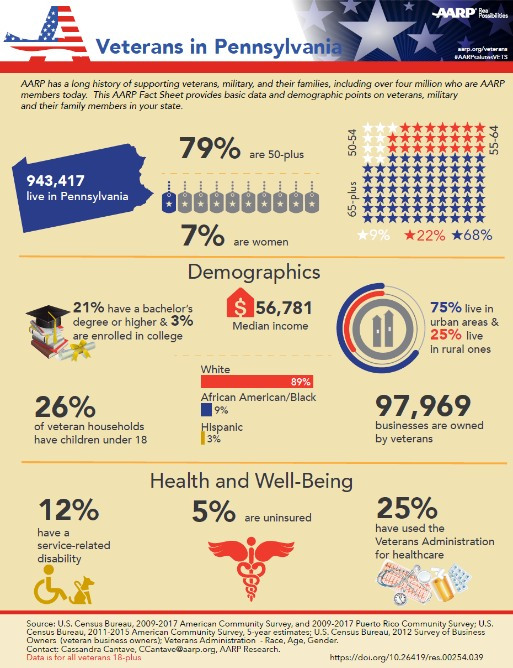
“AARP has published the 2019 Veterans in America Infographics. The infographics contain demographic data as well as data on veteran’s health and well-being, including use of the Veterans Administration for healthcare services. Each individual state has its own infographic which profiles veterans in that state.”
The Veteran Population Projection Model process includes blending data from various data sources to produce Veteran counts at the national, state and below state levels for certain demographics. It includes projecting the number of Veteran records out into the future for 30-years. The projeced Veteran population is both declining in number and becoming more evenly distributed in age. Whereas the annual change for the total Veteran population is -1.8 percent per year and the male Veteran population is -2.2 percent per year, the annual change to the female Veteran population is +0.6 percent per year. May 10, 2019