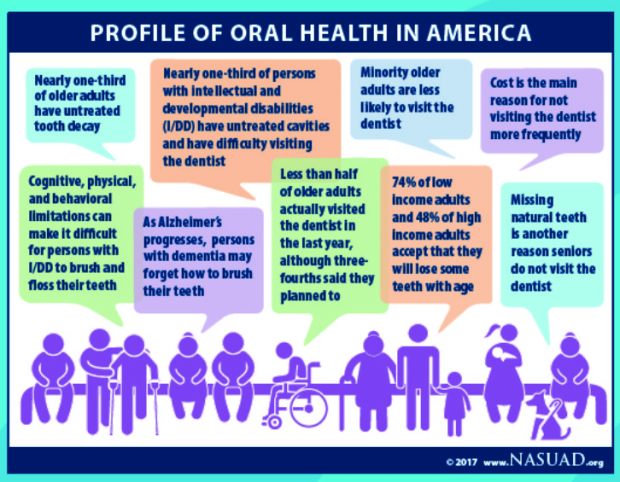
The National Association of States United for Aging and Disabilities has created an infographic that depicts an overview of the oral health experiences of older adults and persons with disabilities. This resource highlights who is impacted, what happens as a result, why this happens, and where we can go from here. The infographic includes compelling data, such as people with disabilities forgo dental treatment due to cost nearly three times more than people without disabilities, and more than 1/3 of adults 65 years or older have lost all of their teeth.
 Click on the graphic or here to download the complete infographic report including experiences of older adults and persons with disabilities.
